Another quarter down. No doubt, you have a lot of high-impact interactions, report placements and inclusions, analyst insights and other wins amassed. Time to showcase them!
What is analyst relations reporting?
With analyst relations (AR) reporting, AR pros can highlight program metrics, results and AR’s impact on the business, across a defined period of time. Metrics vary program-to-program, and reporting output often takes various forms — a slide deck, PDF, dashboard, etc. — depending on your audience and their needs and preferences.
Why do we do AR reporting?
We hear you… when AR’s near-endless to-do list clashes with limited hours in the day, do you really want to spend your time reporting on results — or executing, so you can drive more?
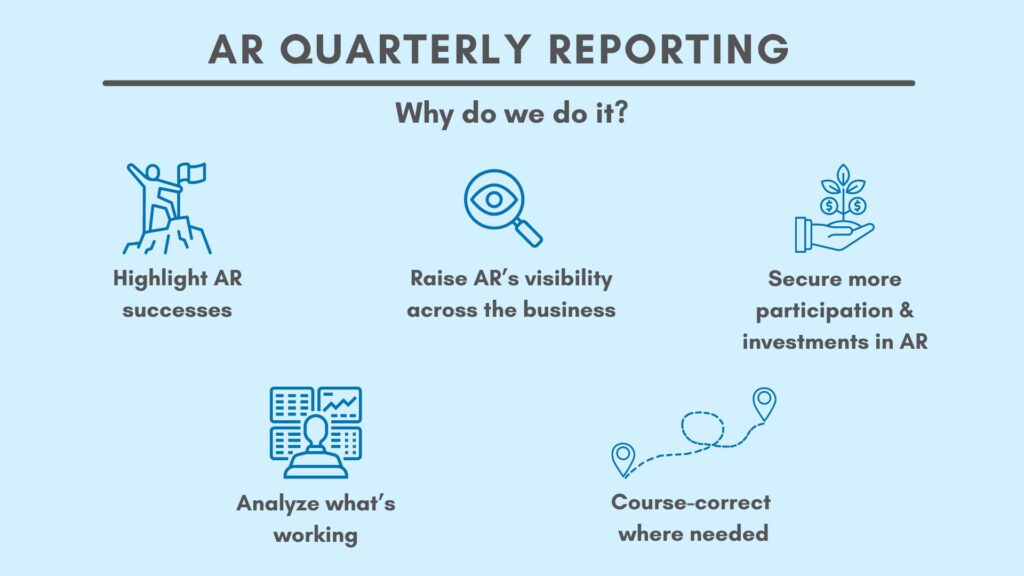
Reporting is often a must-do, though (and you can use AR software and analytics to save you time). Here are some reasons why AR reporting on a quarterly basis is valuable:
- You know you rock… but does everyone else? Reporting enables you to promote key successes, demonstrate AR’s value to the business, and prove ROI. This, in turn, can even help AR secure more support: in terms of executive participation, budget dollars, additional resources, etc.
- Similarly, raise AR’s visibility. There may not be a lot of internal awareness around AR at your organization — especially if you’re part of a small or single-person team. Other leaders and team members may be exposed to only a small portion of what AR does. Reporting enables you to highlight AR’s scope of activity and results, demonstrating why it’s a strategic function.
- Involve more business areas. AR touches and is valuable to a lot of functions: product development, product marketing, sales, communications and customer success, to name a few. Reporting enables you to show business units what AR can do for them — from analyst insights that guide product development, to licensed reports that inform prospects and more — and drive deeper and more beneficial collaboration.
- See what’s working, and course-correct where needed. Reporting gives you the opportunity for reflection. Take a look at your AR program: Where are your efforts having the greatest impact? How are activity levels, analyst sentiment, report placements (etc.) trending? What’s not working as well as you’d like — and what changes can be made to optimize things?
What should you report on?
Different AR programs have different goals; you’ll want to measure and report on what’s most valuable to you and your organization.
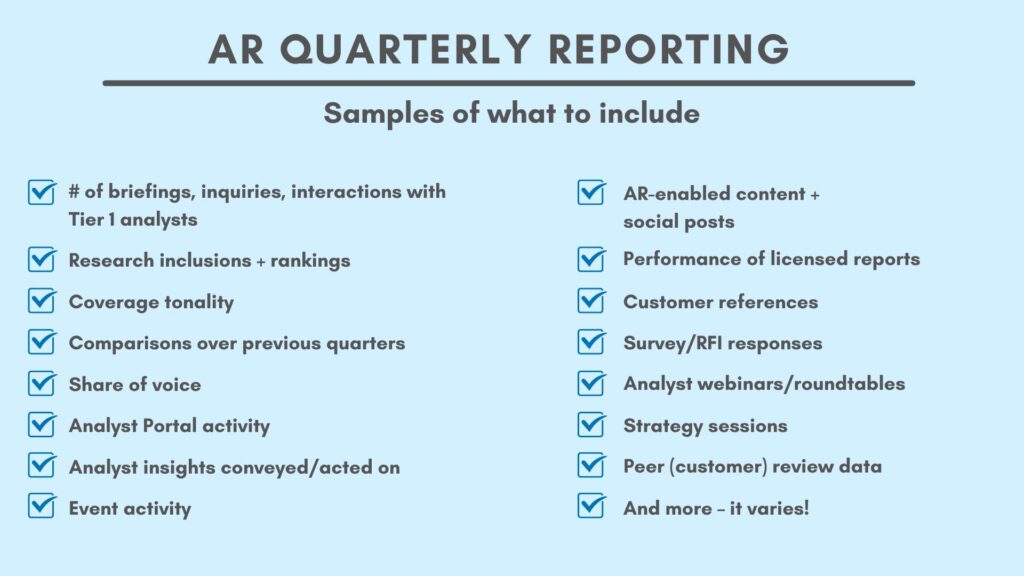
In general, activity-based reporting (such as number of analyst briefings, inquiries, interactions with Tier 1 analysts, etc.) remains a popular way to show momentum, but more holistic reporting will include analyst insights and action on those insights, sales enablement, marketing enablement, growth and reach of program, impact of program/perception, etc.
Research inclusions and rankings — as well as analyst quotes from research — and tonality of coverage also typically feature prominently in quarterly reports. You can compare interaction volume and report inclusions to previous quarters, or to the same time period last year, to illustrate traction.
In addition to reporting on activity and inclusions, it’s also important to show how those areas have translated into meaningful results: E.g., Is analyst sentiment now trending more positive? When possible to measure, has increased awareness among analysts resulted in more recommendations to buyers? And though it’s often not easy to track, can you demonstrate AR’s impact on deals?
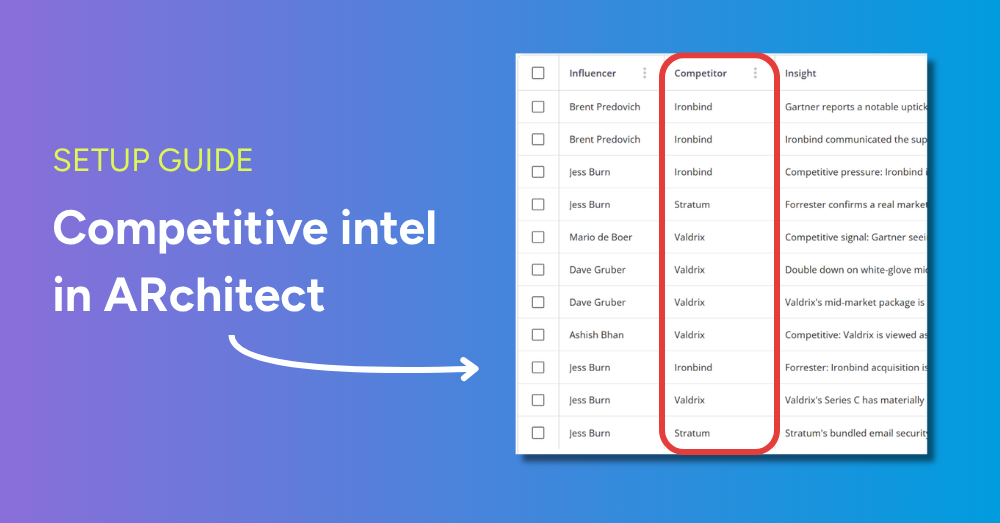
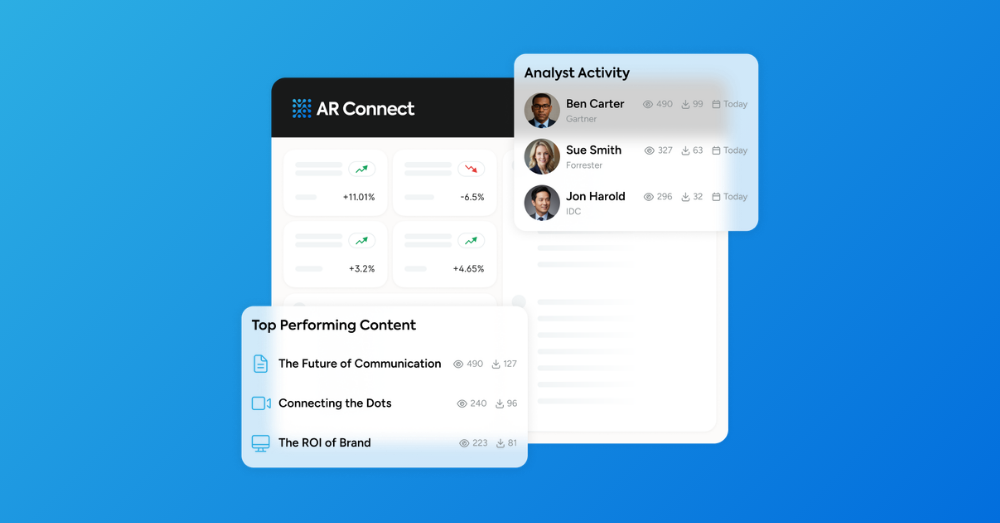
AR programs also often report on share of voice (how their analyst coverage stacks up against key competitors), analyst day events (number of 1:1s, attendees, coverage of the event, etc.), Analyst Portal activity (registrants, active analyst users, etc.) and important analyst insights that have been communicated to the business (e.g., how those have impacted strategy, messaging, etc.).
As mentioned, you can also summarize indicators of marketing and sales enablement, such as analyst reports licensed (and views/performance), AR-driven social posts (number of shares + clicks), analyst content usage in client pursuits, and other AR-enabled content — including webinars with analysts (number of attendees), AR-driven blog posts (page views) and more.
And as peer review sites continue to intersect with AR — and Gartner Peer Insights Voice of the Customer reports now cover more markets (not just ones with Magic Quadrants) — customer review data is increasingly included in quarterly reporting. Look at areas including: reviews generated, “willingness to recommend” score, the mix of industries and regions represented in reviews, and more. You can highlight quotes from highly positive reviews in your reporting, too, as well as leverage the quotes in social media campaigns.
Who gets your quarterly AR reports?
Your reports will likely be relevant to, and consumed by, a range of people: business unit leaders, executive committees, marketing teams — and whomever AR reports to.
Keep in mind, many of these leaders aren’t involved in AR on a day-to-day basis. Reporting is an opportunity to summarize and distill your work for them — making it digestible and comprehensible (avoiding both jargon and getting “in the weeds”) and packaging results in a compelling way.
Oftentimes, AR pros create quarterly reports because they’ve been asked to do so; it’s a need or mandate within their business. But even if reporting isn’t required, it’s often still a best practice: a way to be strategic, increase AR’s visibility and proactively keep leaders in-the-loop. One company we work with recently hired a new CMO. By presenting the CMO with a quarterly results summary, the company’s AR director immediately demonstrated value, helped the CMO get up-to-speed on AR strategy and results, and started the relationship off well.
What are AR reporting best practices?
The process of creating and compiling quarterly AR reports goes much more smoothly and successfully when you adhere to best practices, including:
- Know your audience. Who’s seeing your reporting? The exec team, sales leaders, marketing leaders, etc.? Package your results in a way that’s meaningful to them.
- Work collaboratively with leaders to understand what they want to see. Is there a way for AR to support their KPIs too?
- Be visual. Graphs, charts, infographics, pull quotes… they all help you present your results in a high-impact way.
- Be consistent in your reporting and the data you collect, to enable quarter-over-quarter comparisons and so your audience will be familiar with your reporting format.
- … But be flexible enough to account for variation, so you can include new types of results/successes: whether that’s reporting on an analyst event, important insights from a strategy session that occurred during the quarter, etc.
- Put context around your results: What does good look like? How do your results compare to previous quarters? When possible — how do they compare to competitors? Some AR pros start their reporting with a summary slide to provide this context.
- Don’t make reporting a mad scramble! Establish consistent tracking procedures with your AR team during the quarter — What types of info are you collecting? How are you scoring analyst sentiment? etc. — so everyone is on the same page. If you’re using a system like ARchitect to log interactions and insights, try to record them as they happen. That way, it’s easy to click to generate reports at the end of a quarter… and you’re not sinking time into tracking down the data that powers them.
What’s the benefit of a quarterly reporting cadence?
Many AR programs report on results on a monthly basis. While this is very beneficial, it often becomes a heads-down or even check-the-box exercise, with little opportunity to strategize and dig into the “why” behind results. In contrast, adding a quarterly cadence as well can provide a checkpoint for reflection. What’s more, while results can vary — sometimes widely — on a month-to-month basis (depending on product launches, events, etc.), they tend to even out over the course of a quarter, facilitating better comparisons.
Need help with reporting?
ARInsights provides robust, interactive and intuitive analytics capabilities to support your reporting needs. For more hands-on and comprehensive support, our services team provides a range of AR services: including ARchitect administration and AR program reporting that’s packaged professionally, matches your company’s branding, and reflects your metrics and desired cadence. We’re here to help you drive success — and highlight that success via reporting as well.